Spatial deconvolution of BRCA with OT plan
Use R packages for plotting temporarily. The python fucntion is in development.
library(scatterpie)
library(RColorBrewer)
library(grDevices)
library(Seurat)
library(tidyverse)
library(reshape2)
file_path <- '/data/BRCA/'
Load 10x Visium spatial data. The st folder contains cellranger outputs, and can be downloaded from 10xGenomics.
brca <- Load10X_Spatial(paste0(file_path,'st/'))
brca <- NormalizeData(brca)
brca <- ScaleData(brca)

# load cluster information of reference scRNA data
brca_cluster <- read.csv(paste0(file_path,'sc/Whole_miniatlas_meta.csv'), header = T,row.names = 1) %>% .[-1,]
Load plot function. The ‘spatial_function.R’ is stored here.
source(paste0(file_path,'spatial_function.R'))
Load OT plan from uniPort output.
ot <- read.table(paste0(file_path,'OT_BRCA.txt'),sep = '\t',header = T,row.names = 1)
ot <- as.data.frame(t(ot))
rownames(ot) <- sapply(strsplit(rownames(ot),'\\.'),function(x)x[[1]])
ot_map <- mapCluster(ot,meta = brca_cluster, cluster = 'celltype_major')
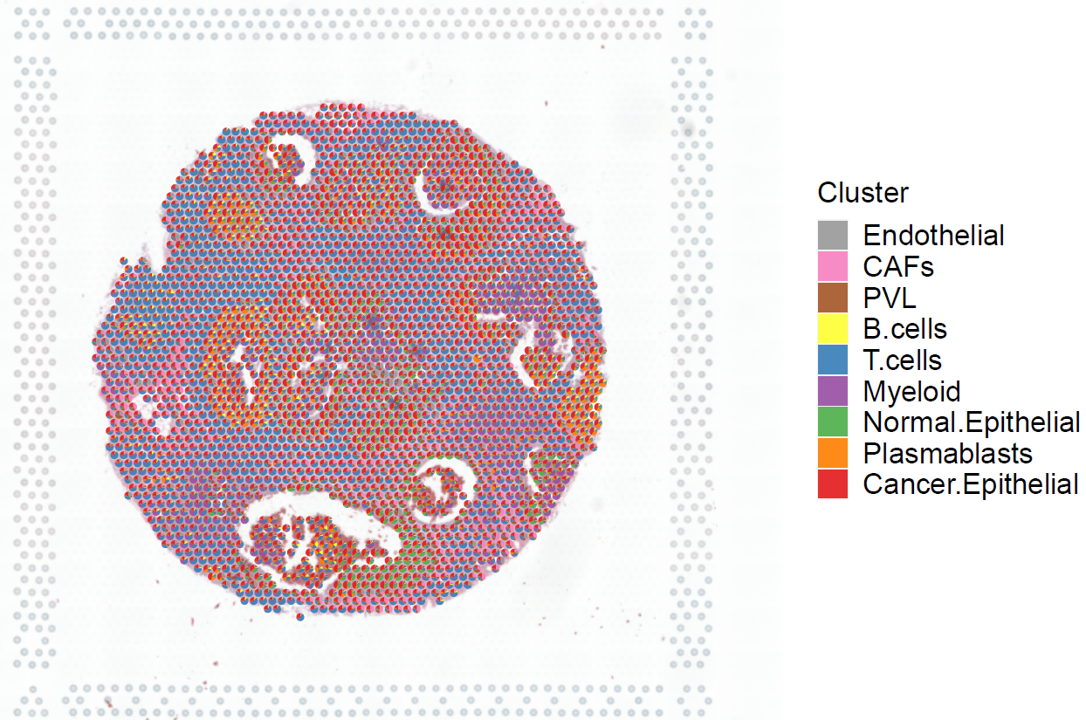
Visiualization of cluster proportion.
p <- stClusterPie(ot_map = ot_map, st = brca)
print(p)
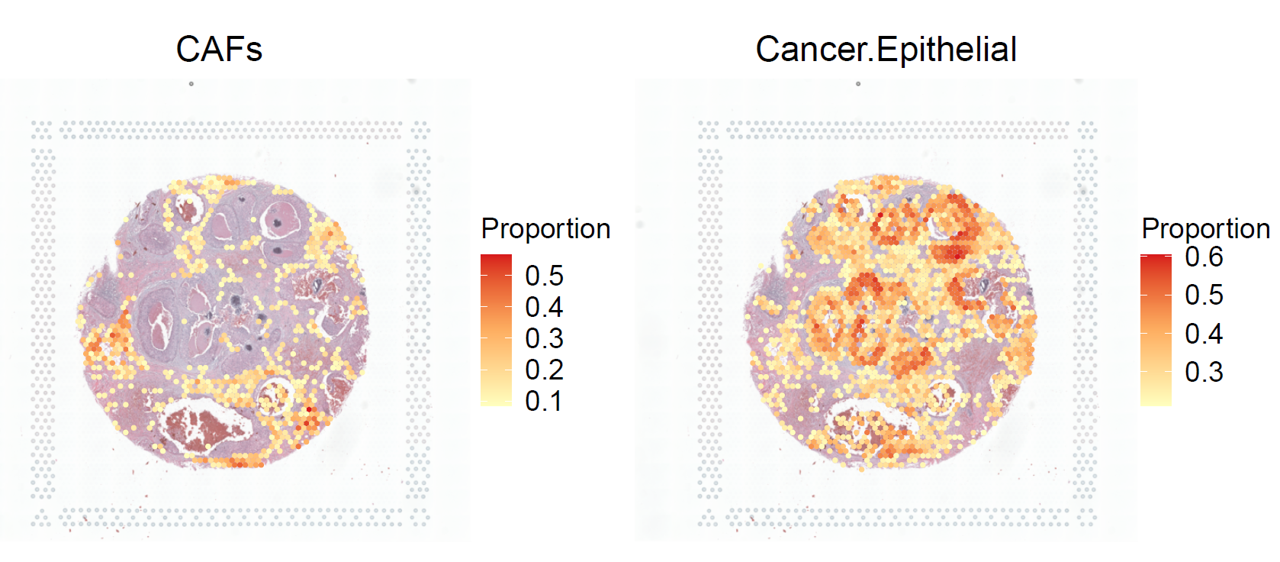
p1 <- stClusterExp(ot_map, brca, cluster = 'CAFs',cut = 0.15, point_size = 1.1)
p2 <- stClusterExp(ot_map, brca, cluster = 'Cancer.Epithelial',cut = 0.35, point_size = 1.1)
p1+p2